
Concept Maps
What are concept maps?
Concept maps are visual representations of information. They can take the form of charts, graphic organizers, tables, flowcharts, Venn Diagrams, timelines, or T-charts. Concept maps are especially useful for students who learn better visually, although they can benefit any type of learner. They are a powerful study strategy because they help you see the big picture: by starting with higher-level concepts, concept maps help you chunk information based on meaningful connections. In other words, knowing the big picture makes details more significant and easier to remember.
Concept maps work very well for classes or content that have visual elements or in times when it is important to see and understand relationships between different things. They can also be used to analyze information and compare and contrast.
Making and using concept maps
Making one is simple. There is no right or wrong way to make a concept map. The one key step is to focus on the ways ideas are linked to each other. For a few ideas on how to get started, take out a sheet of paper and try following the steps below:
- Identify a concept.
- From memory, try creating a graphic organizer related to this concept. Starting from memory is an excellent way to assess what you already understand and what you need to review.
- Go through lecture notes, readings and any other resources you have to fill in any gaps.
- Focus on how concepts are related to each other.
Your completed concept map is a great study tool. Try the following steps when studying:
- Elaborate (out loud or in writing) each part of the map.
- List related examples, where applicable, for sections of the map.
- Re-create your concept map without looking at the original, talking through each section as you do.
Examples of concept maps
Example 1: This example illustrates the similarities and differences between two ideas, such as Series and Parallel Circuits. Notice the similarities are in the intersection of the 2 circles.

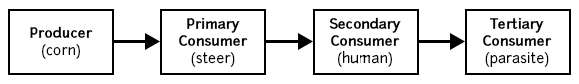
Example 2: This example illustrates the relationship between ideas that are part of a process, such as a Food Chain.
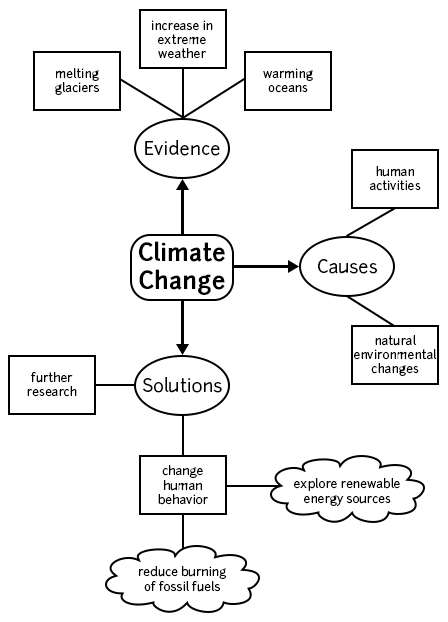
Example 3: This example illustrates the relationship between a main idea, such as climate change, and supporting details.
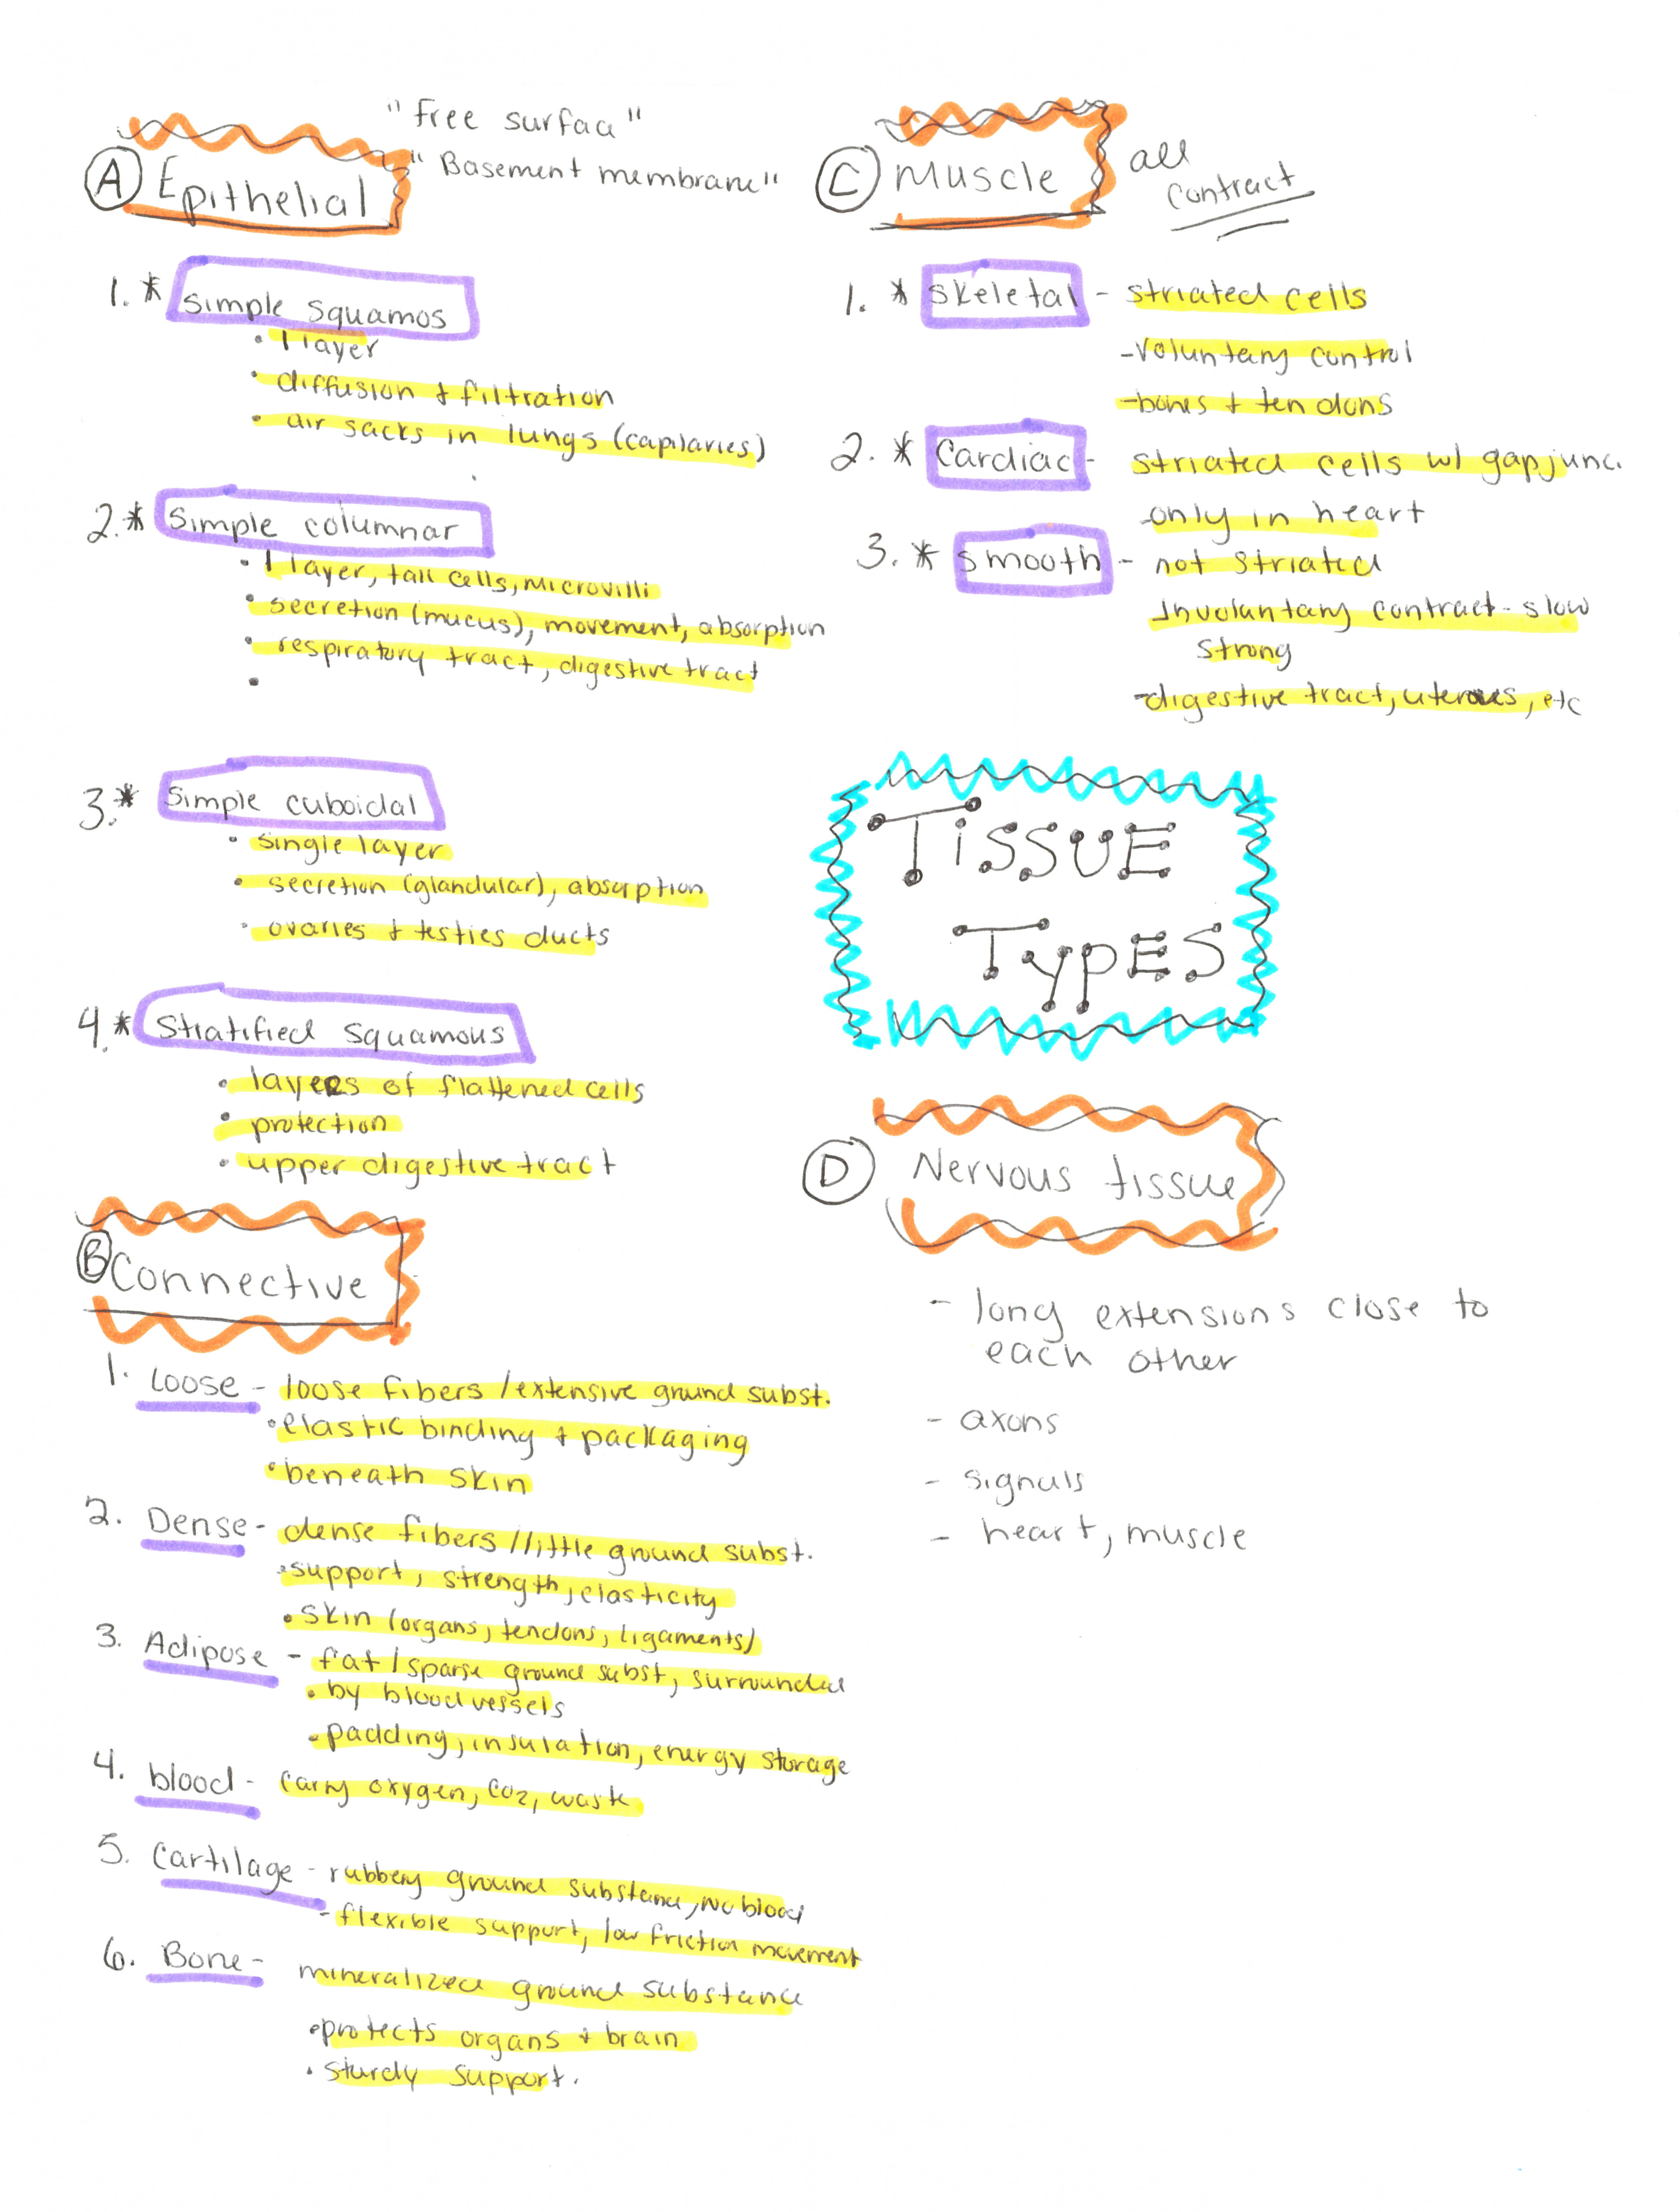
Example 4: Outlining is a less visual form of concept mapping, but it might be the one you’re most familiar with. Outlining by starting with high-level course concepts and then drilling down to fill in details is a great way to determine what you know (and what you don’t know) when you’re studying. Creating an outline to start your studying will allow you to assess your knowledge base and figure out what gaps you need to fill in. You can type your outline or create a handwritten, color-coded one as seen in Example 5.
Additional study strategies
A concept map is one tool that you can use to study effectively, but there are many other effective study strategies. Check out these resources and experiment with a few other strategies to pair with concept mapping.
- Study Smarter, Not Harder
- Higher Order Thinking
- Metacognitive Study Strategies
- Studying with Classmates
- Reading Comprehension Tips
Make an appointment with an academic coach to practice using concept maps, make a study plan, or discuss any academic issue.
Attend a workshop on study strategies to learn about more options, get some practice, and talk with a coach.
